
Search
The magnifying glass in the menu opens search, available on every page. Type a municipality, RCM or region name, an indicator (income, language, housing…) or a page name (Territory, Géo-Québ, Politics). Suggestions appear as you type; the best match takes you to the right place (profile, data map, 3D map or the page you asked for). On the home page, the banner search field does the same thing. Nothing is sent to a server: search runs in your browser.
Territory: the 3D map and its controls
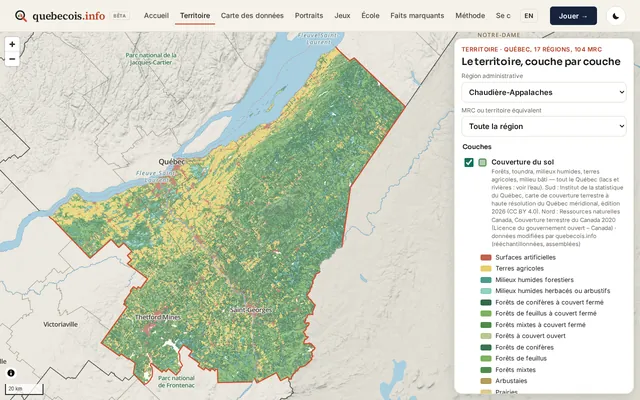
The Territory page opens on Quebec as a whole. Choose an administrative region or an RCM in the menus. In the panel, you can show or hide:
- land cover, the permanent agricultural zone, protected areas, dense residential areas;
- roads and streets, place names, CMAs and agglomerations;
- the “Hide boundaries” option, to read the territory without administrative borders.
The 3D view is based on terrain (elevation data). You can turn it on, adjust terrain exaggeration (1×, 2.5×, 5×, 10× buttons or a slider from 1 to 10), reset the camera and put north back at the top.
At city zoom, urban detail adds building footprints, parks and greenspace, bridges and a sharper street grid (OpenStreetMap data). 3D building volumes are optional: they show approximate heights, only at close zoom. Aerial imagery (aerial and satellite photos) can be draped on the terrain, under the land cover, with an opacity slider.
Capture mode prepares an image to save (PNG), with a quebecois.info watermark. Each layer shows its source and licence.
Profiles of municipalities, RCMs and regions
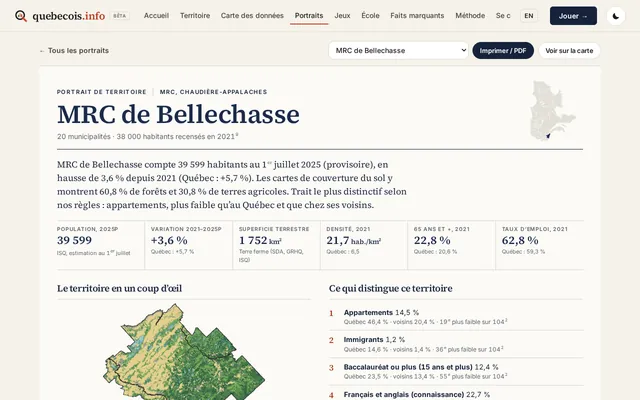
A profile summarizes a municipality, an RCM or a region: key figures, a map, what sets the territory apart, comparisons with Quebec and its neighbours, and the sources. The Print / PDF button produces a print-ready version. Electoral ridings can be consulted on the data map and in the Politics section (elected officials by riding); they do not have a separate profile page.
Politics and the 12-axis compass
The Politics section brings together Members of the National Assembly, federal MPs from Quebec, official bills, and a 12-axis quiz (a 24-question short mode or a 60-question full mode). The quiz describes your answers on these axes and compares them only with recorded votes of MPs from Quebec in the House of Commons. It is not voting advice, and it is not a grade.
You answer on a five-level scale, plus “I don’t know”. The calculation runs in your browser: nothing is sent or stored on a server. A result link encodes only your answers in the address. On the home page, the “Your political compass” card asks the first questions; answers already given stay in your browser for the rest of the test, at civique.html#quiz.
Highlights
The Highlights page keeps one fact per territory, compared with Quebec and its neighbours, according to public rules (see “Selection rules” on the page). You will also find province-wide trends and the highest or lowest values of an indicator. These are not merit rankings: they are sorts and comparisons, with their source.
Method and sources
The Method and sources page explains where the figures come from, the licences, the dates, the aggregations and the reliability rules (for example census margins of error). Each map and each chart also shows its source just underneath. When in doubt, the official file prevails.
Share and capture
- Territory: capture mode downloads a PNG of the view, with a quebecois.info watermark.
- Data map: PNG export saves the view with its source. The Compare page can do the same for a bivariate view.
- Profiles: Print / PDF, with the sources at the bottom of the page.
- Political compass: “Copy the result link” puts only your answers in the address. Nothing is sent to a server.
- Géo-Québ: at the end of a game, a shareable summary appears. Scores stay in your browser.
French / English
The EN / FR button in the menu opens the same page in the other language (English pages are under /en/). Your choice is kept in the browser. The data (official names, figures) stay the same; only the interface labels change.
The round button next to the menu switches the light or dark theme; that choice is also kept in your browser.
Read the statistics
Median or mean?
The median splits the population into two halves: half earn less, half earn more. The mean (average) adds everything up and divides by the number of people; a few very high incomes pull it up. For incomes, the median better describes the “typical” person.
95% margin of error
Many census figures come from a sample (the long-form questionnaire). Statistics Canada then publishes a 95% confidence interval: the true value has 95 chances in 100 of being inside it. The margin is half of that interval. The smaller the group, the larger the margin.
Three levels of reliability
- $52,300 Shown normally: margin of 10% of the value or less and at least 250 people (for a percentage: margin of ±2 points or less).
- $48,900 Greyed out, “unreliable”: margin of 10 to 25%, or a group of 100 to 249 people (percentage: ±2 to ±5 points). The range appears on hover.
- sample too small Hidden: margin over 25% or fewer than 100 people (percentage: more than ±5 points).
The amounts above are display examples, not data.
“Not published”
An empty cell in the official files is not a zero: the figure was not published (confidentiality, insufficient quality or a territory that is too small). The site then shows “not published”, never 0.
When two indicators move together from one RCM to another, that is a territorial correlation. It does not mean the people involved are the same, or that one causes the other. Check the year under the chart before comparing two figures: for example, the 2021 census measures 2020 incomes.